Has anyone ever met a documentation system they both liked and found useful? I love Evernote as much as the next guy but the simple list view has its limitations. Most wikis present information in a tree view where pages are restricted to a parent-child relationship. Neither are very useful or intuitive for documenting complex systems!

I’m a very visual thinker. I know from experience that when dealing with several layers of abstraction, having a good visualization can be very helpful. And when I say good, I mean good in the sense that the visualization is as close to reality as possible. Shane Parrish and others remind us that the map is not the territory, but we can get pretty damn close. And I think graphs can help (so does neo4j, shockingly). Because it’s 2017, and we deserve more optimal ways to visualize ideas and systems.
Why graphs? Graphs are inherently simple. There are nodes and edges. That’s it. Nodes represent a “thing”, edges represent a “relationship between things”. There’s no parent-child restriction; any node can be related to any other node. Visually, the relationships can be shown compactly and the information structure is more flexible. Using this as our foundation, we can start to build something useful.
So, here’s what I’ve got so far. I’m calling it Episteme (from the Greek for “knowledge, science, or understanding”). It’s a desktop app powered by Electron and is a simple graph of nodes and edges where nodes are some entity we want to document. Here’s an example based on my current SwingStats architecture:
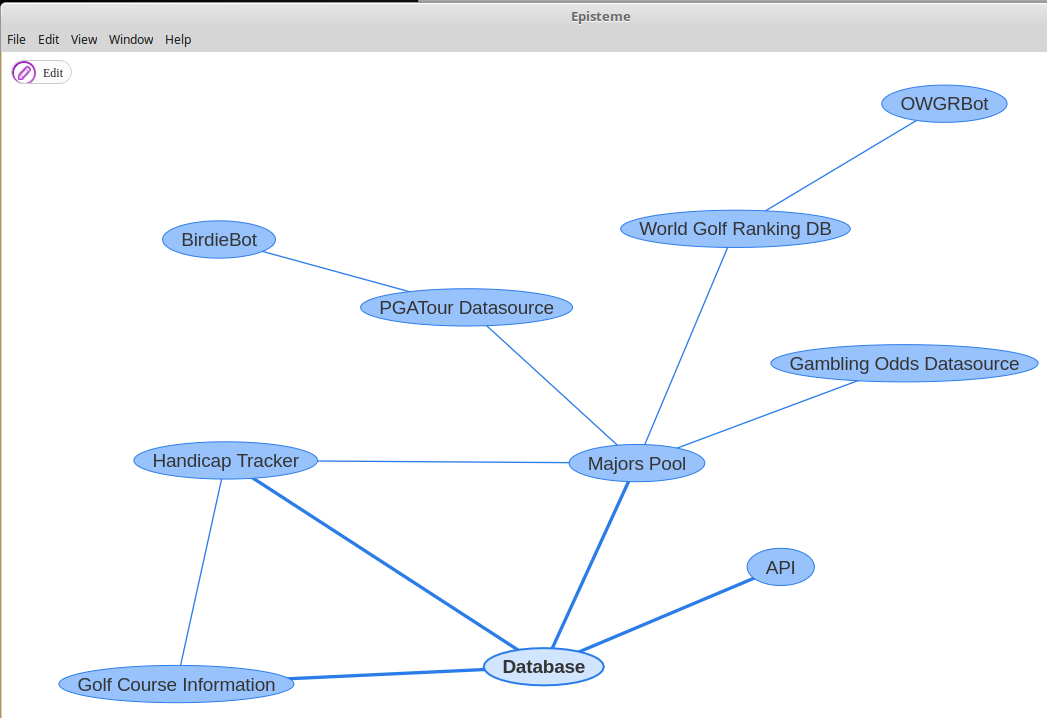
Here the nodes represent backend services, webapps, datasources, and APIs while the edges connect the nodes that interact in some way. Clicking on each node will bring up a Markdown-based document which will autosave on edit:
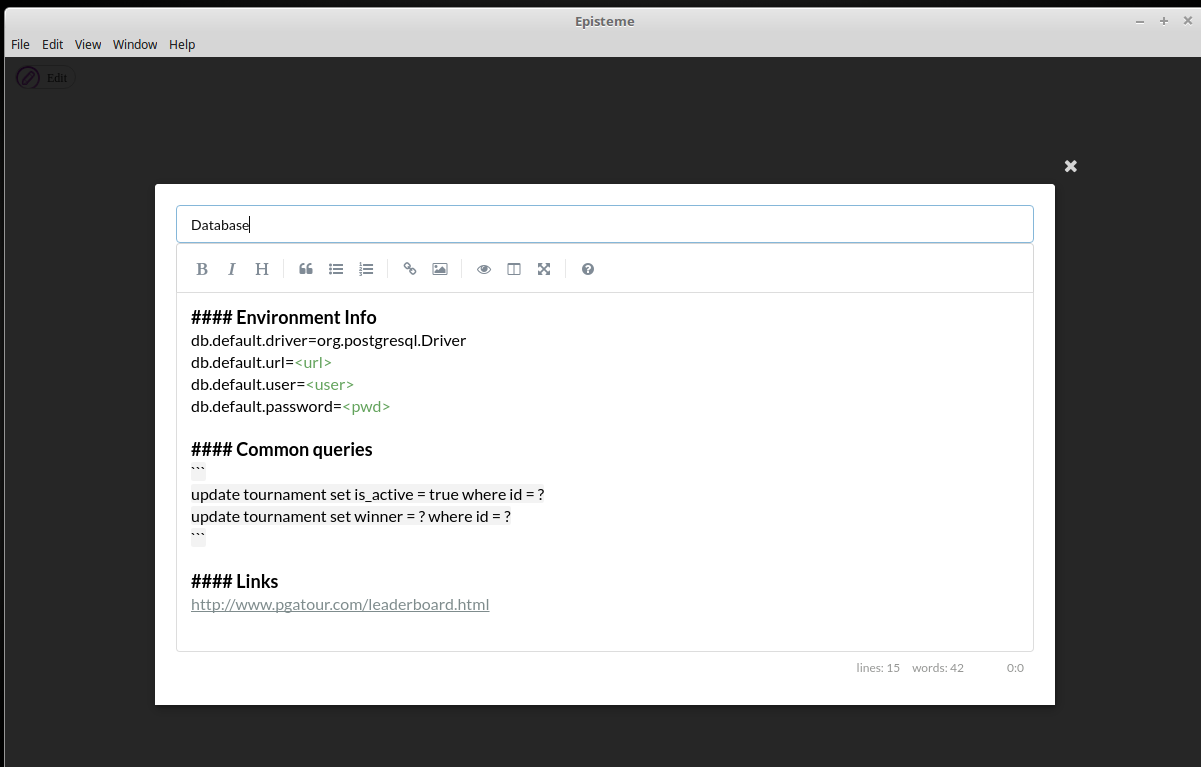
I’ve already been using it at my current client to help me navigate the dozens of systems and their interactions. I’ve found the most value in quickly accessing common commands (SQL, ssh, docker, etc.), environment information and links. It’s definitely sped up development time as I don’t need to constantly search Confluence or Google for rote memory stuff like query syntax. It just feels like the information is much closer at hand.
I’m hoping to add some functionality to make it more context-driven. I think tagging nodes would serve well here, depending on what project/context I’m working on I could filter the graph by tags to only show relevant nodes. As the graph grows, having a “Jump To” button for nodes would be nice. Full-text search is probably inevitable too.
Another interesting extension would be having teams share and collaborate on the graph. Maybe in a Git-based system with a fork/clone model so you get version control for free and can see how the graph evolves over time? Throw in some live documentation a la Swagger and baby you’ve got a stew going!
One cool thing to note is it took me five hours to get a useful protoype working, and most of that time was spent learning Electron.
I’ve spent a few more hours on refinements but vis.js and SimpleMDE do all the heavy lifting, and
the graph is persisted as a simple JSON file for now. And I’m not a master front-end developer by any stretch of the imagination so if you have an idea,
find some good tools that get you most of the way there and kick the tires!
Interested in this stuff? Wanna see a hosted version so you can take it for a spin? Wanna help me finish building the damn thing? Let me know in the comments below or on Twitter @josephpconley. And thanks to those five brave individuals who voted in my Twitter poll, your feedback is much appreciated!