Teams operate best when they’re focused. Not just on a shared mission, but on the steps needed to get there. If your team is striving to build effectively at scale (and are largely remote to boot), chances are you’ll need some shared dashboard to check progress and monitor what matters.
I’ve used two such tools extensively so far (QuickSight and Superset), and I was surprised to find how easy both were to use for someone as design-challenged as myself. Herein lies a quick review of their functionality (both work well!).
Intro - SEC data-driven portfolio tracker
As a motivating example, I’m using a few simple financial datasets to show off each tool’s capabilities. EDGAR produces quarterly data dumps of all publicly-traded companies in a TSV format. Companies must tag specific fields (e.g. NetIncomeLoss). I added my own portfolio activity and some historical daily price data to build a dashboard showing financial performance, price tracking, and portfolio composition. This afforded me some diversity of chart visuals and non-trivial datasets to work with. Here’s how the tools compare on some core data visualization concepts.
Working with Data - QuickSight (by a hair)
It became clear that with both tools, it’s always simpler to clean and combine data beforehand. While these tools support joins and other ways to massage data, I saved much time by just passing it clean data (reminded me of how to design tables in DynamoDB - think about queries in advance). However, if you choose to do more customization in the tools themselves, you can use custom SQL views (ideally at the source - JDBC for Superset or SQL/Athena for QuickSight).
Caching data seems to be simpler in QuickSight, specifically in relying on SPICE to store a cached version of your data. Superset has this capability using Redis, but this adds a bit more complexity (especially as you are likely hosting Superset on your own).
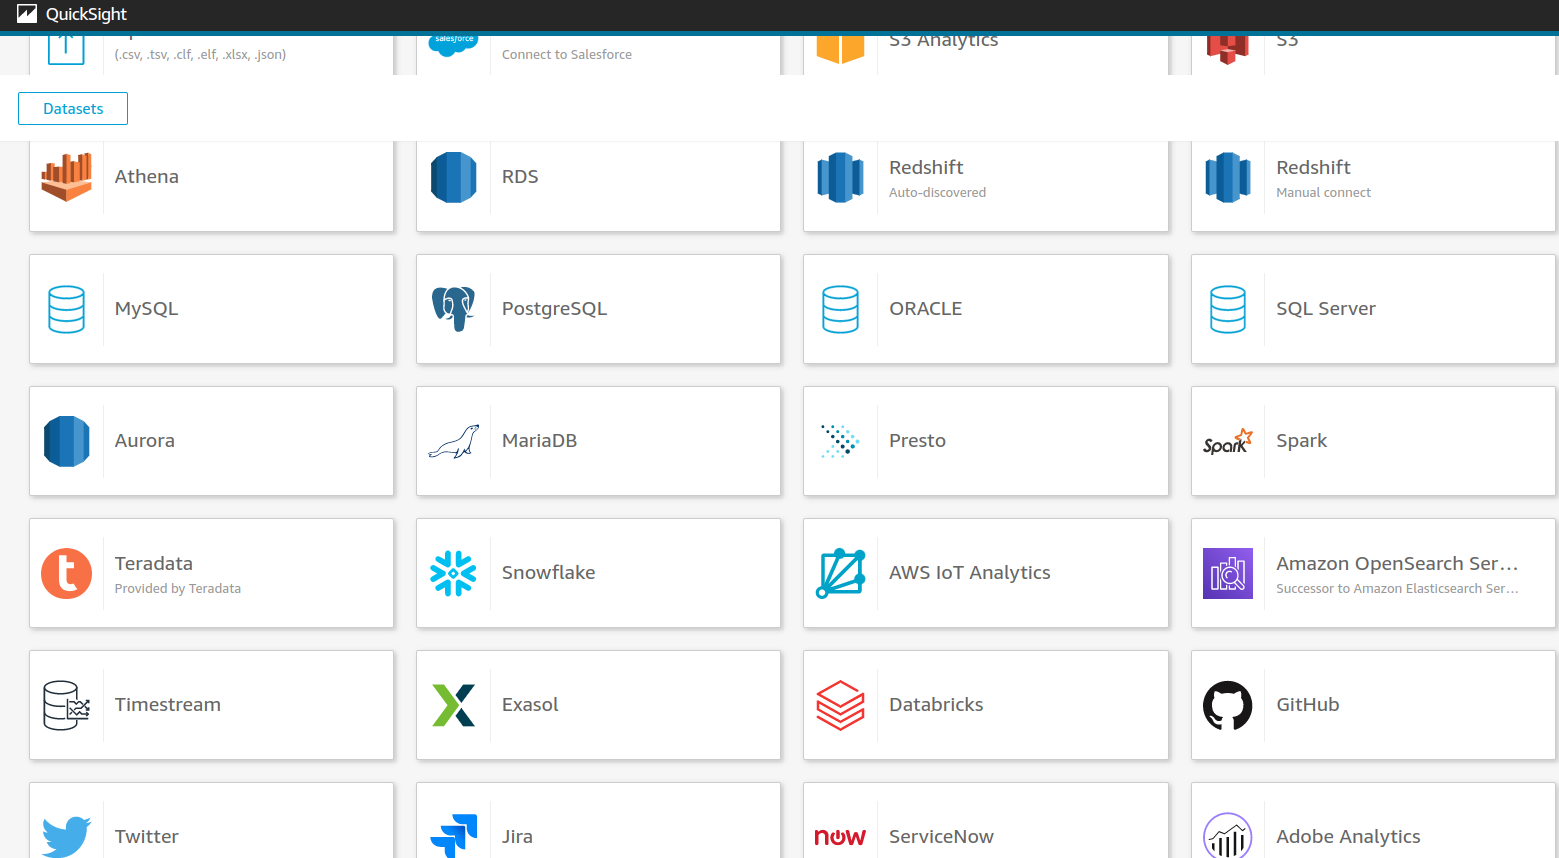
QuickSight’s come a long way over the past few years, and the biggest techdiff it has is its seamless integration with the AWS ecosystem and some other interesting third-party integrations as well (e.g. Twitter, Github). Despite the slight edge, I didn’t find much difficulty in managing data in Superset, and could use a myriad of ways (simple script, Airflow, hell even dbt) to prep data for visualization in either.
Building Charts - Superset (by a nose)
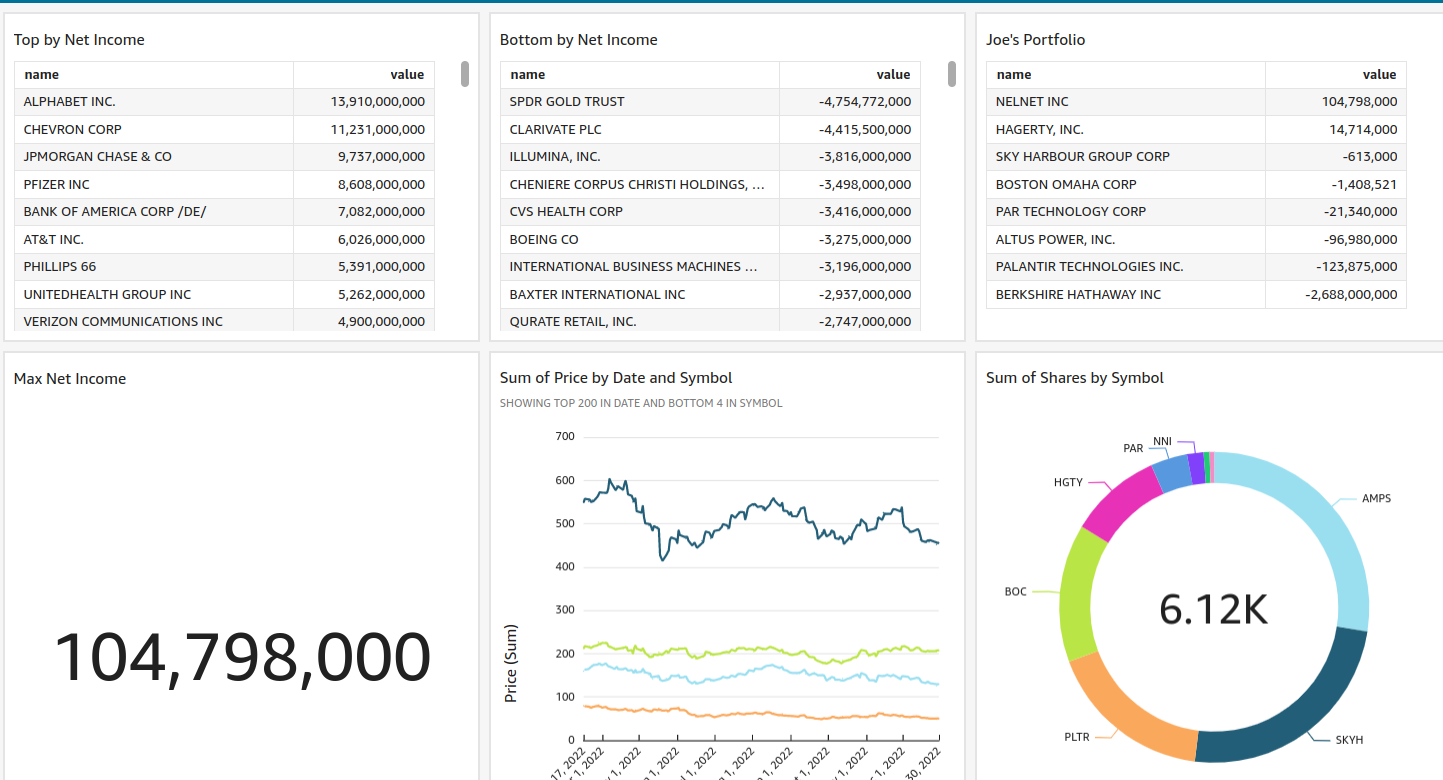
Both tools offer a wide and growing set of visualizations to use, but I was really impressed to see the full list of Superset plugins (even as far as Mapbox plugins and Handlebars for templating). This, for me, made up for the sometimes clunky interface for building charts. The biggest gripe I still have is that updating a custom dataset after building a chart won’t reflect those changes in the chart builder (you can still manually reference any new fields but this wasn’t obvious).
QuickSight works well and offers a wide set of visuals to choose from, and as you can see it was easy to replicate the work from Superset to QuickSight.
Superset
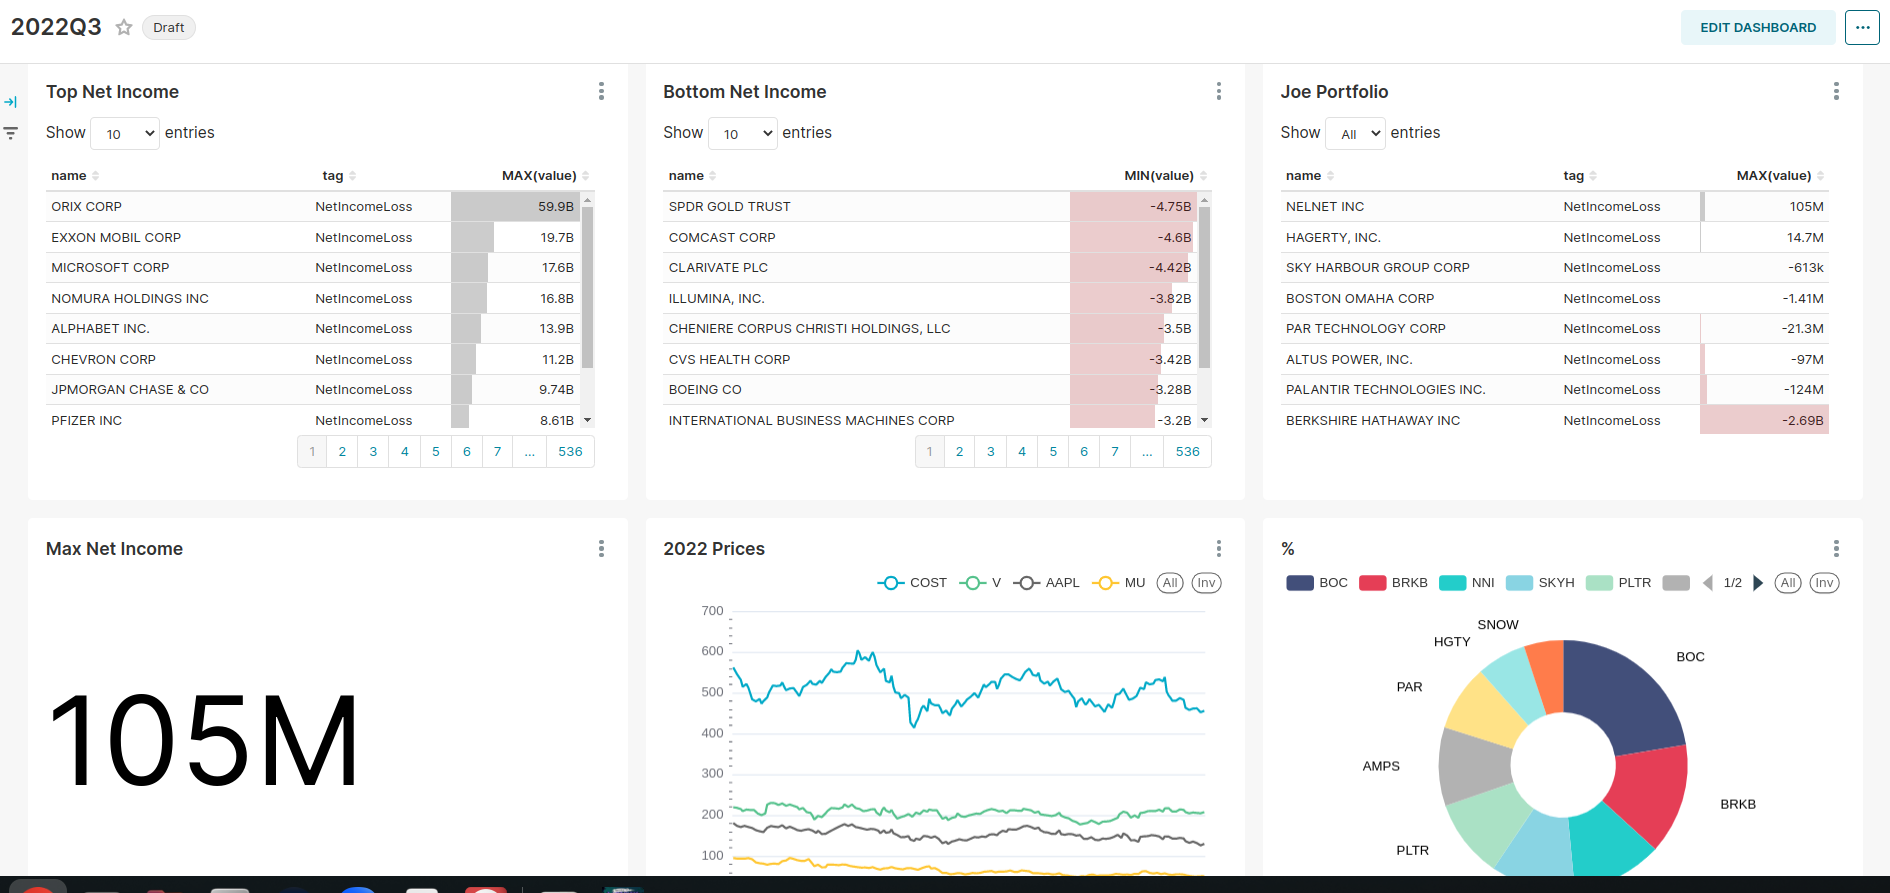
QuickSight
Embedded Visuals - Tie
Both tools take a bit of finagling to get the initial embedding working, but once up and running it works pretty seamlessly. Not much of a difference here, except that Superset doesn’t have a way to have visual-specific filters on a dashboard (the filters are only global), but that can be worked around pretty easily (SS embed, QS embed)
Measure What Matters
Modern BI tools have come a long way. While there’s dozens to choose from, you can’t go wrong with these two. If you’re cost conscious and not married to AWS, Superset should work great. If your heavy AWS users then you probably won’t mind the incremental cost of a few QuickSight seats given how fast you can design and create its easy-to-use visuals.